Radar before-and-after imagery of the Nepal landslide and flood, 26 August 2026
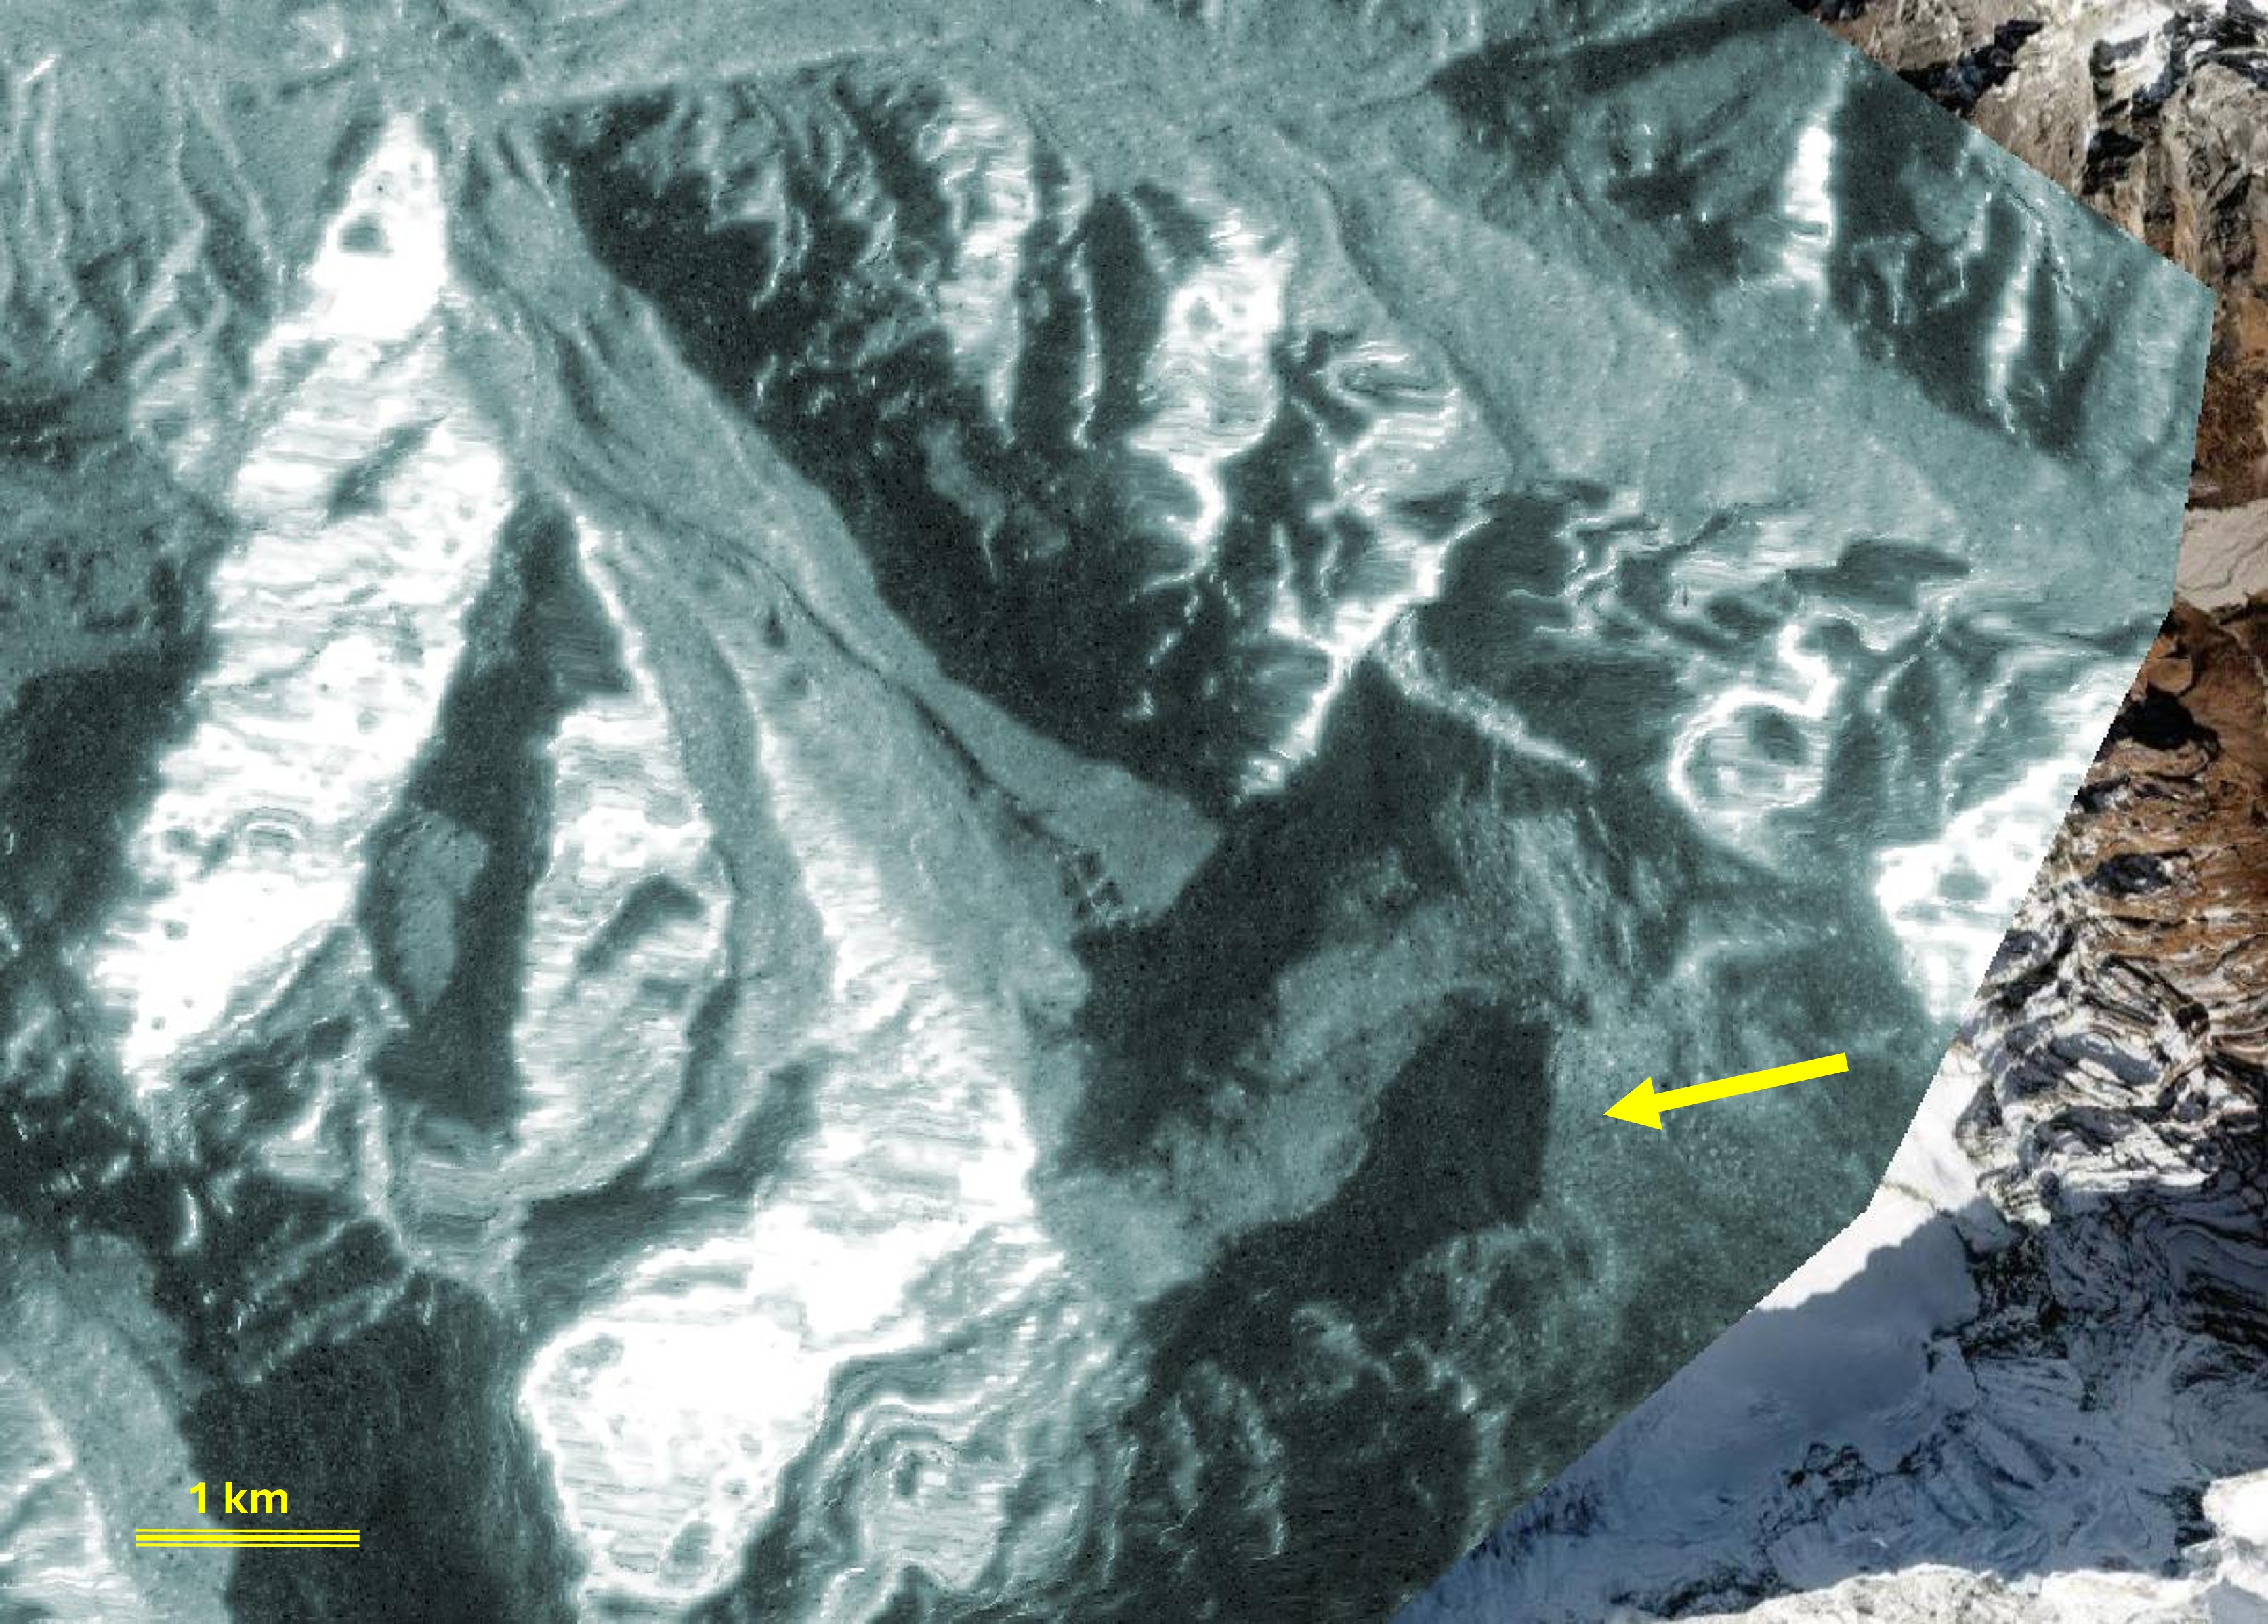
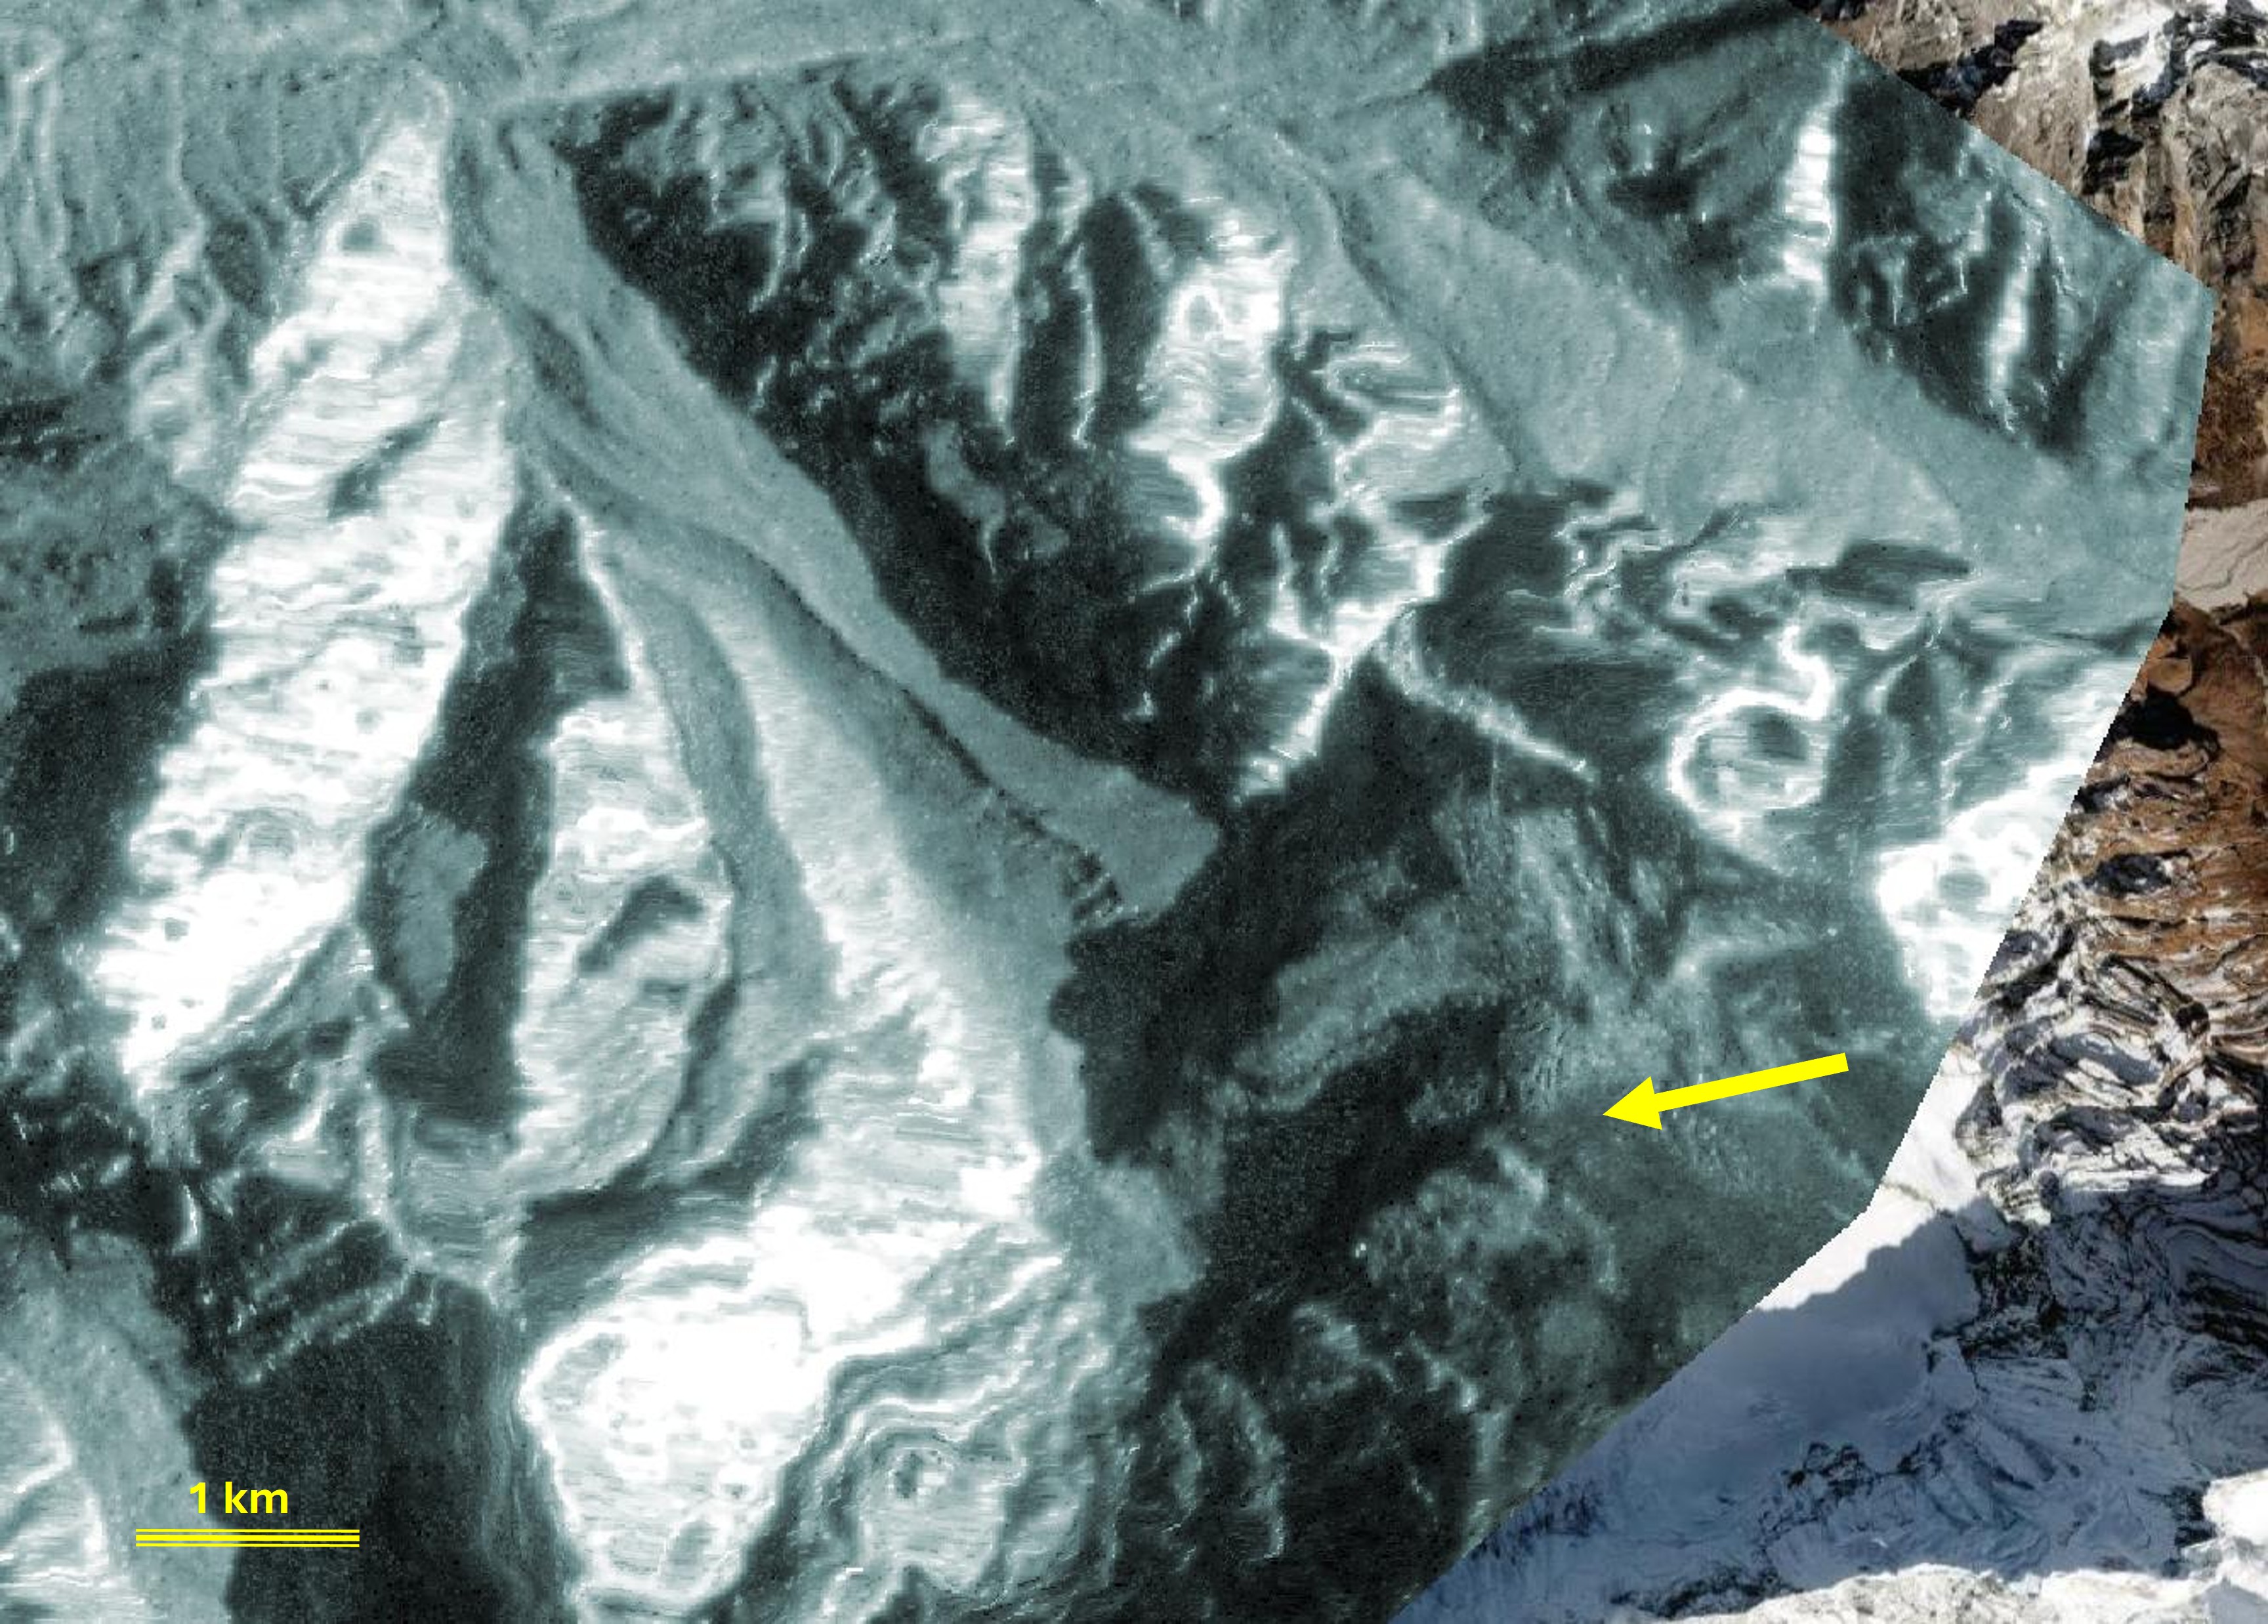
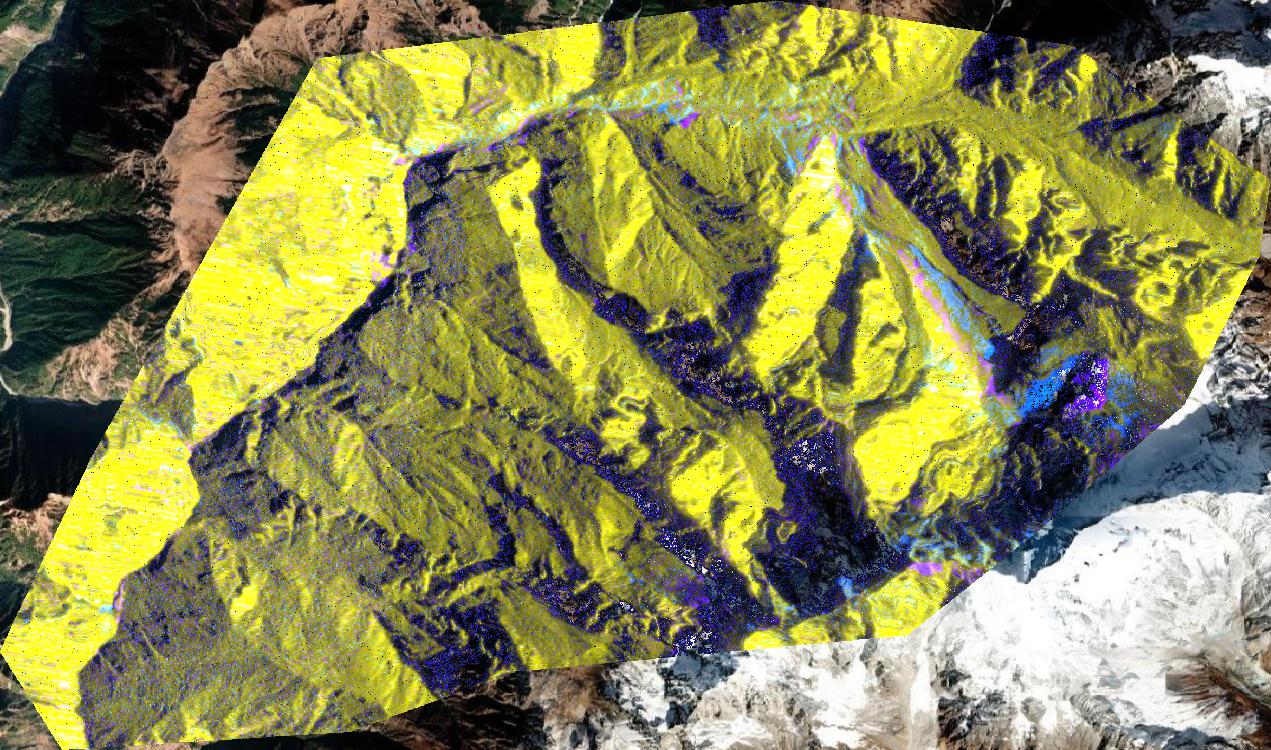
The high Himalayan area where the flood struck is often too cloudy to monitor with optical sensors, but radar sees through cloud and can provide some insight into what happened.
 Before · August 2026
After · September 2026
Before · August 2026
After · September 2026
Left: August 2026 (before the landslide). Right: September 2026 (after the landslide). Sentinel-1 processed data. The brightness differences mostly reflect how each slope faces the satellite, not changes on the ground.
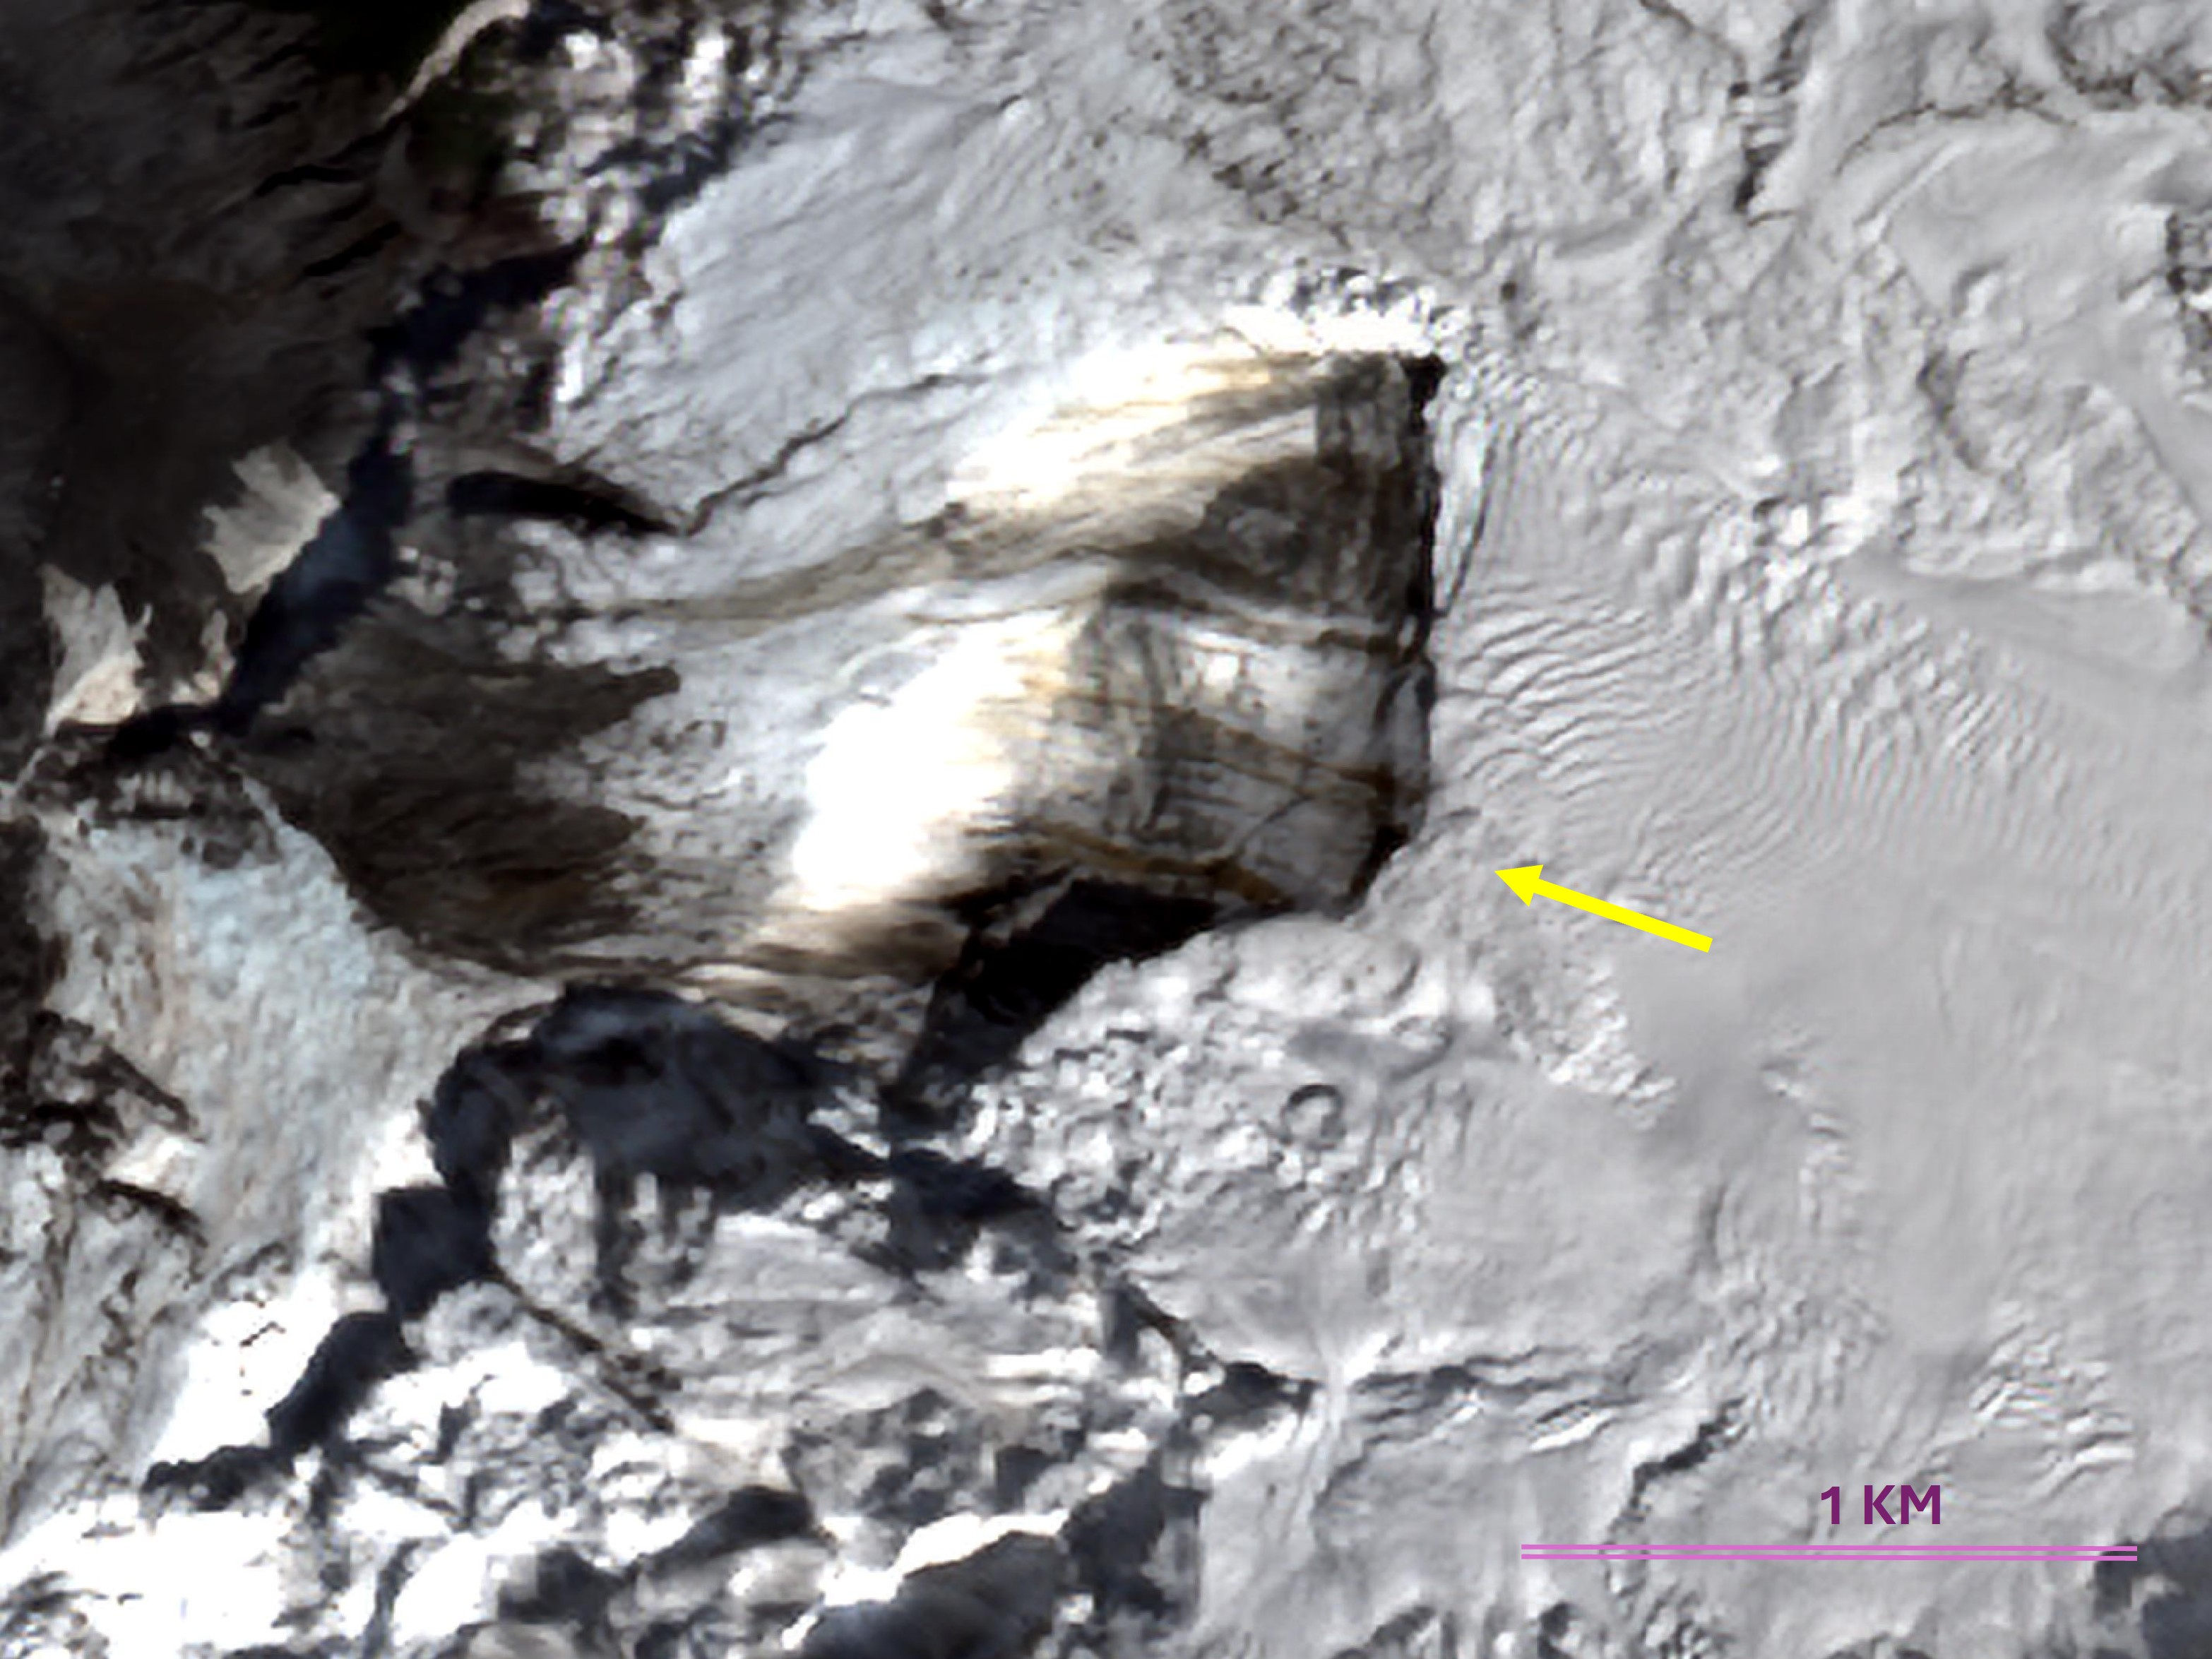
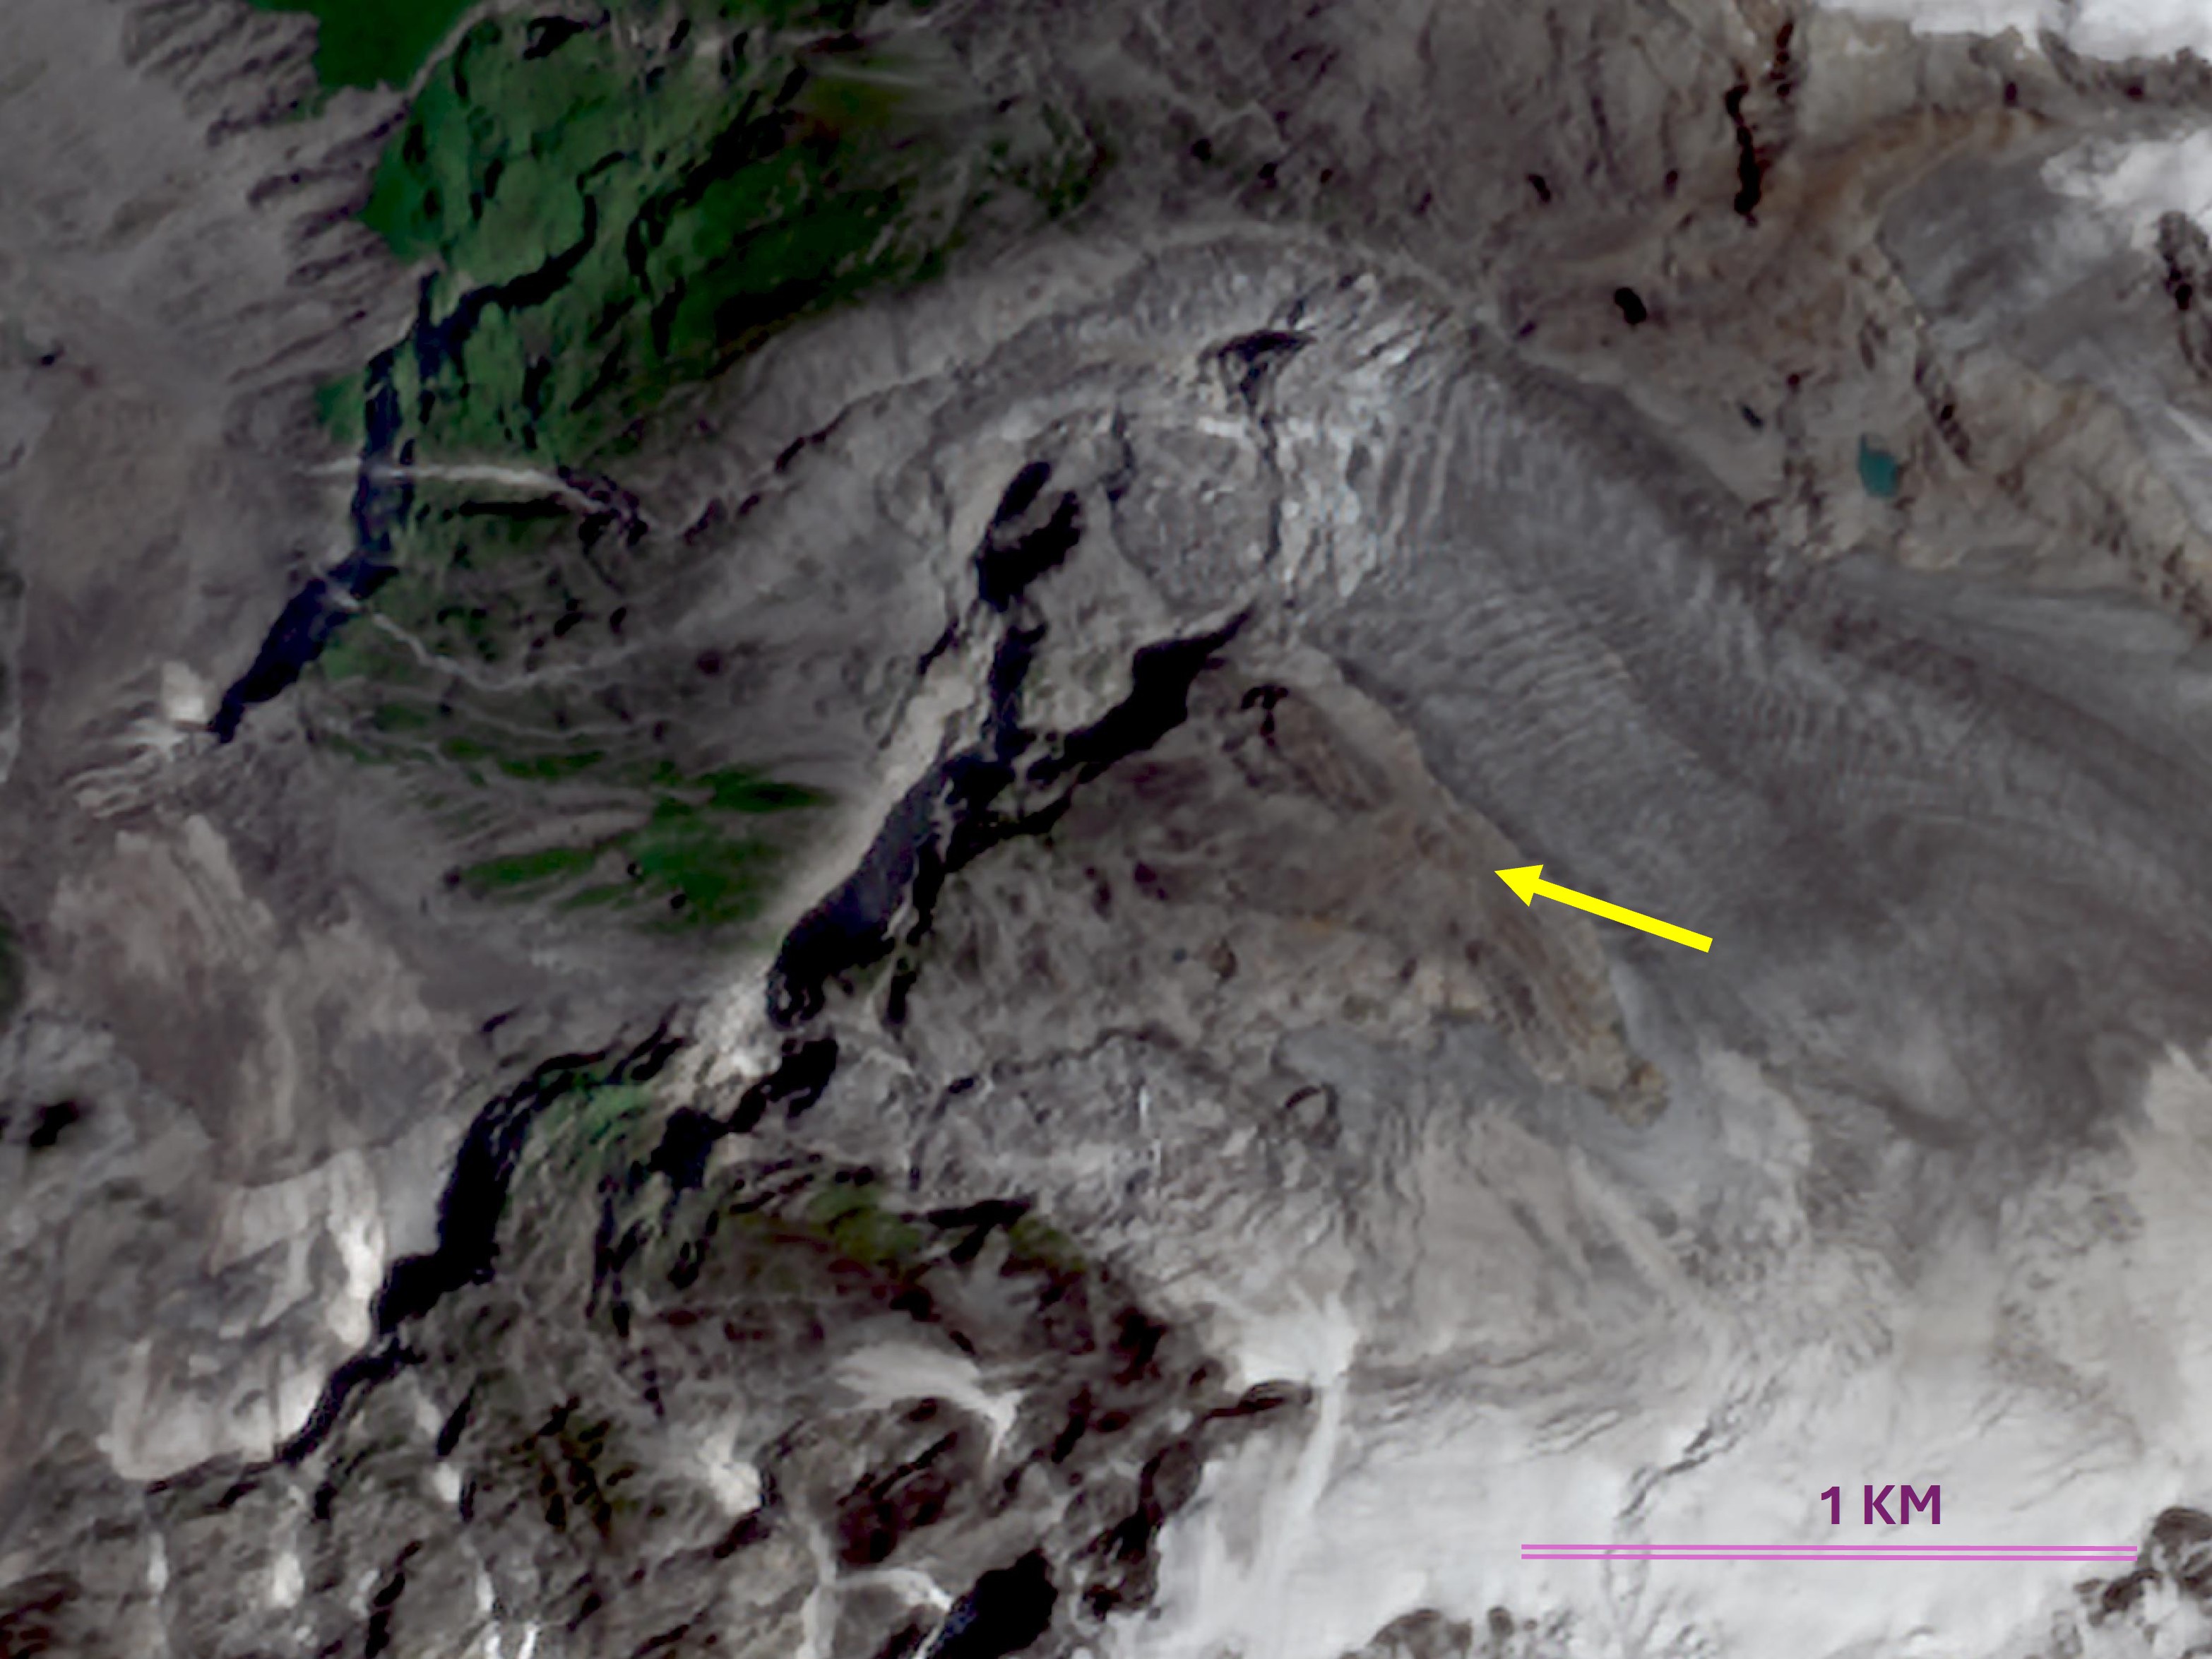 Before · August 2026
After · September 2026
Before · August 2026
After · September 2026
Left: 12-Aug 2026 (before the landslide). Right: 28-Sep 2026 (after the landslide and heavy snowfall). Sentinel-2 natural colour, enhanced resolution, 10 m -> 2.5 m.
A combined analysis of radar (Sentinel-1) and optical (Sentinel-2) imagery from before and after the event reveals the area that collapsed. Fragments of cloud-free Sentinel-2 imagery acquired after the collapse (not shown here) were used to validate the radar analysis. Click images to enlarge.
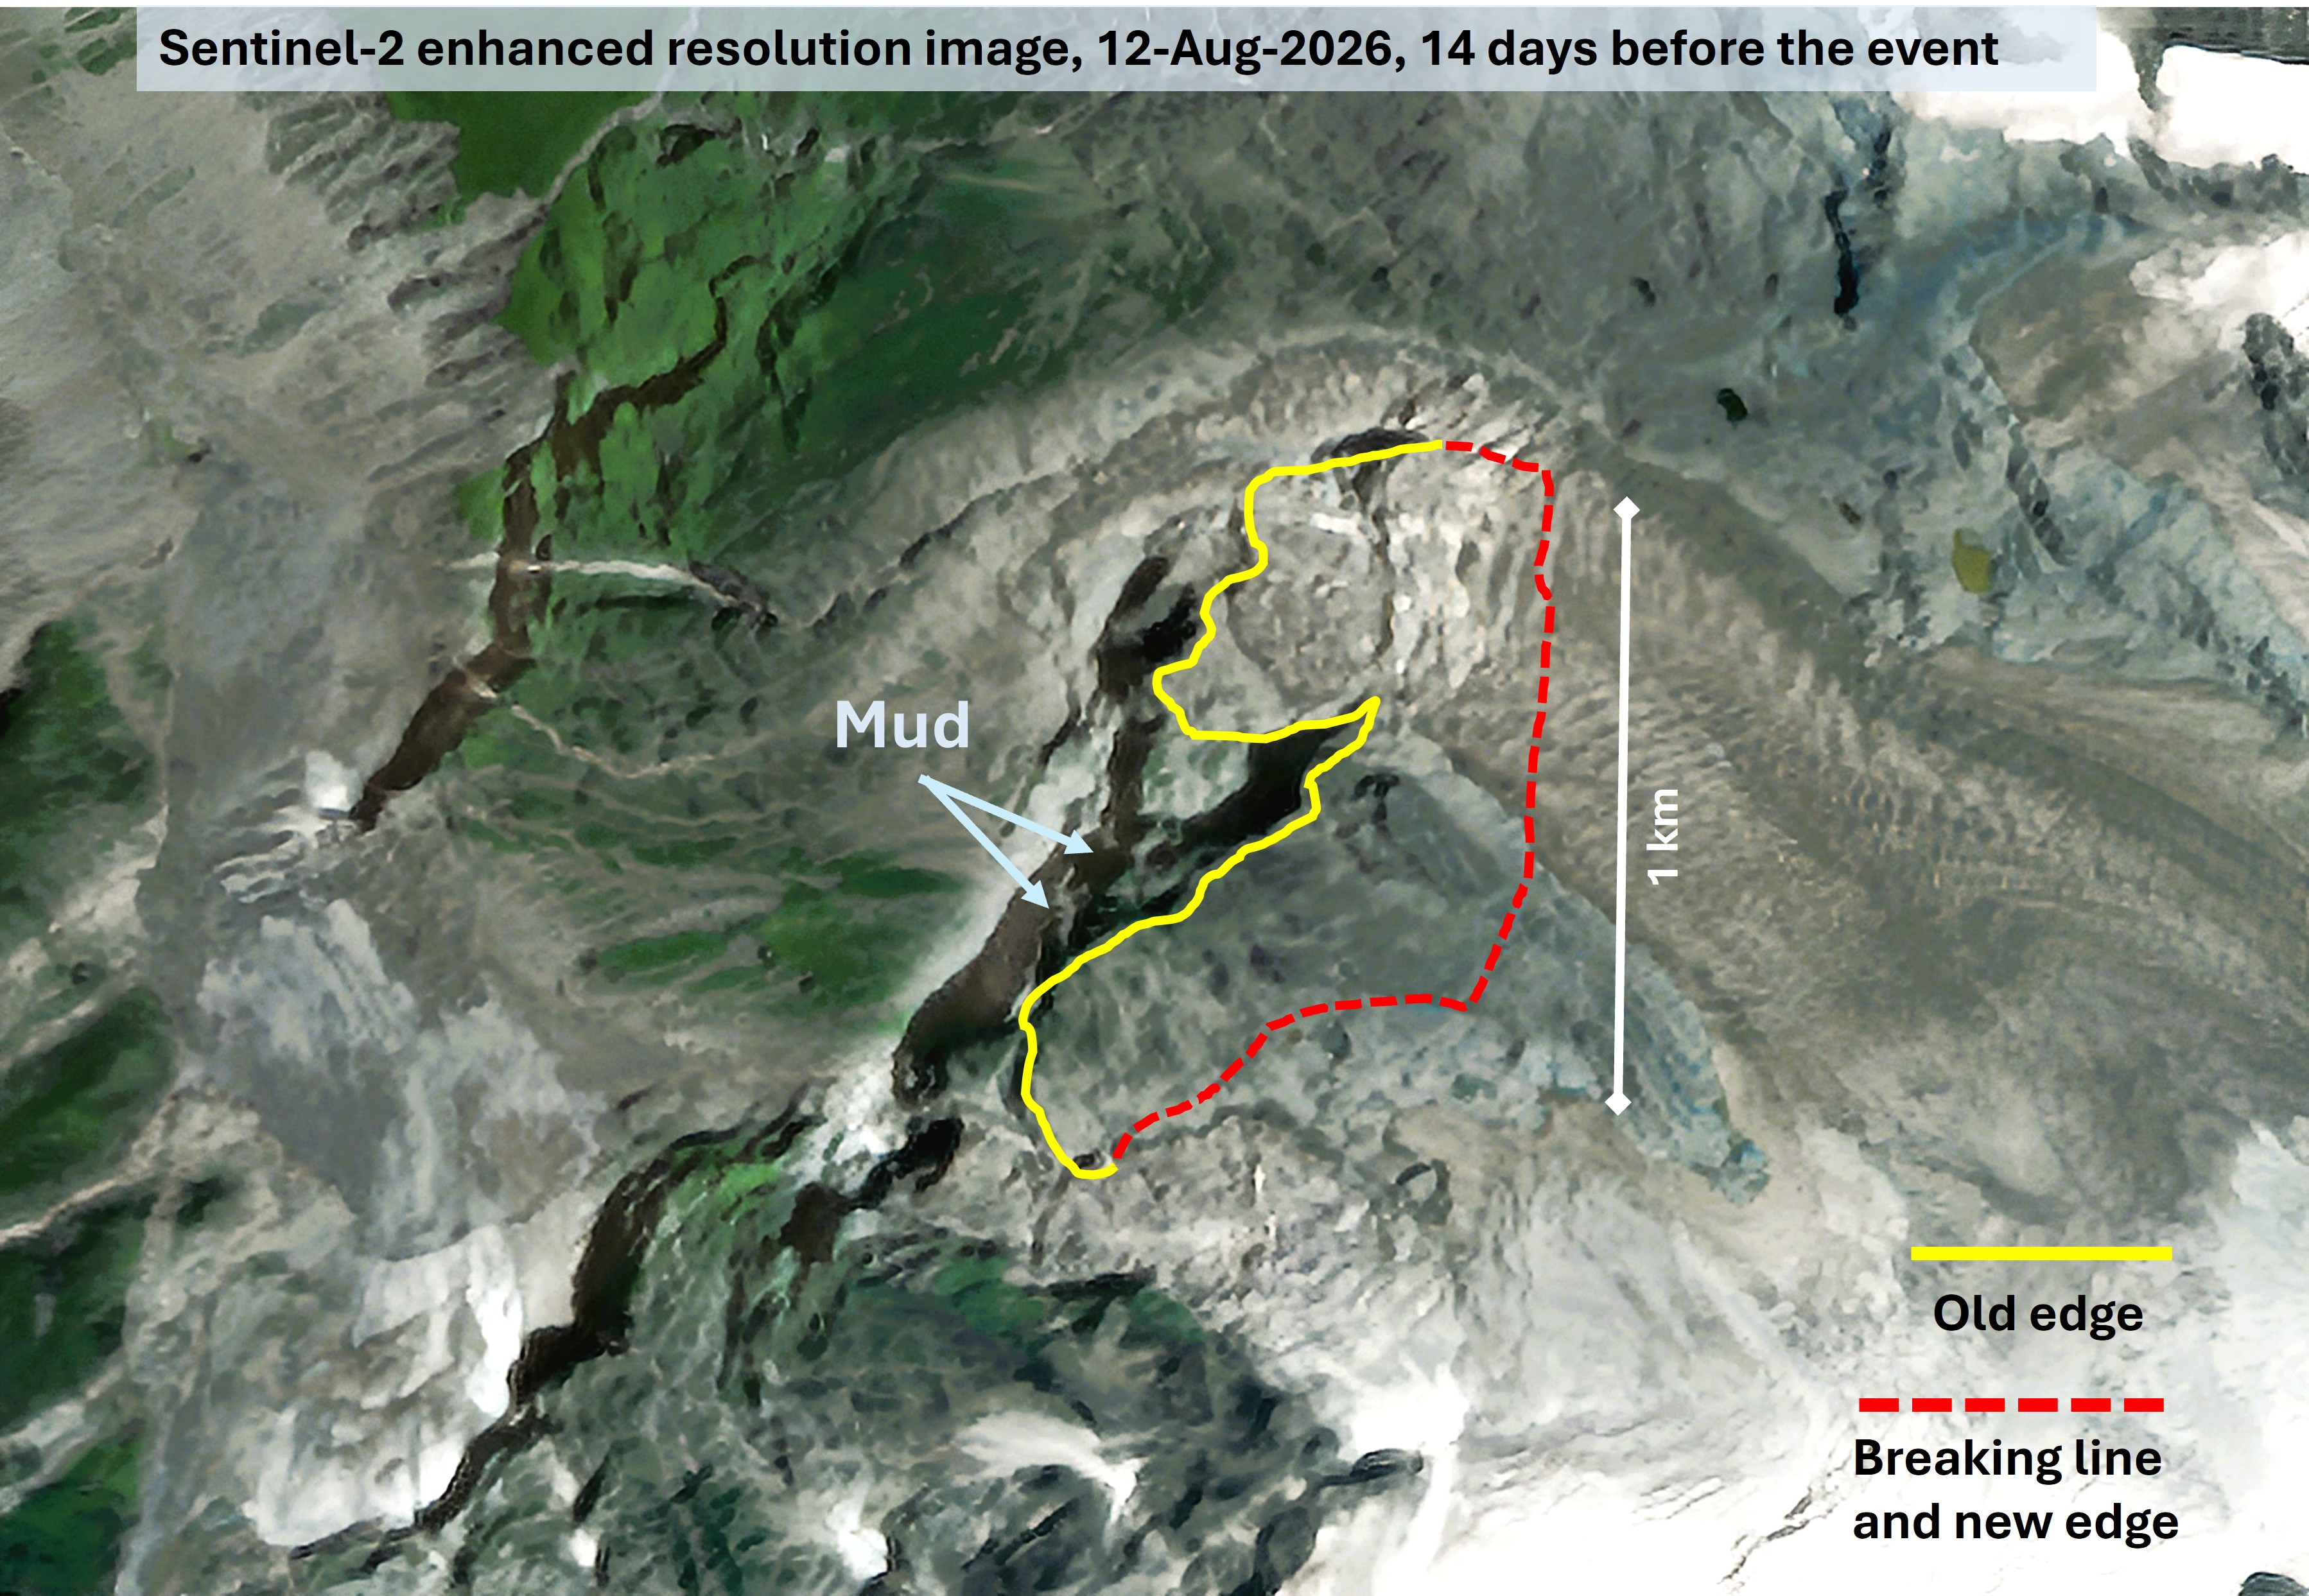
Roughly 500,000 square metres (about 124 acres) collapsed — the equivalent of some 75 football pitches.
Is there a climate-change signal in this event?
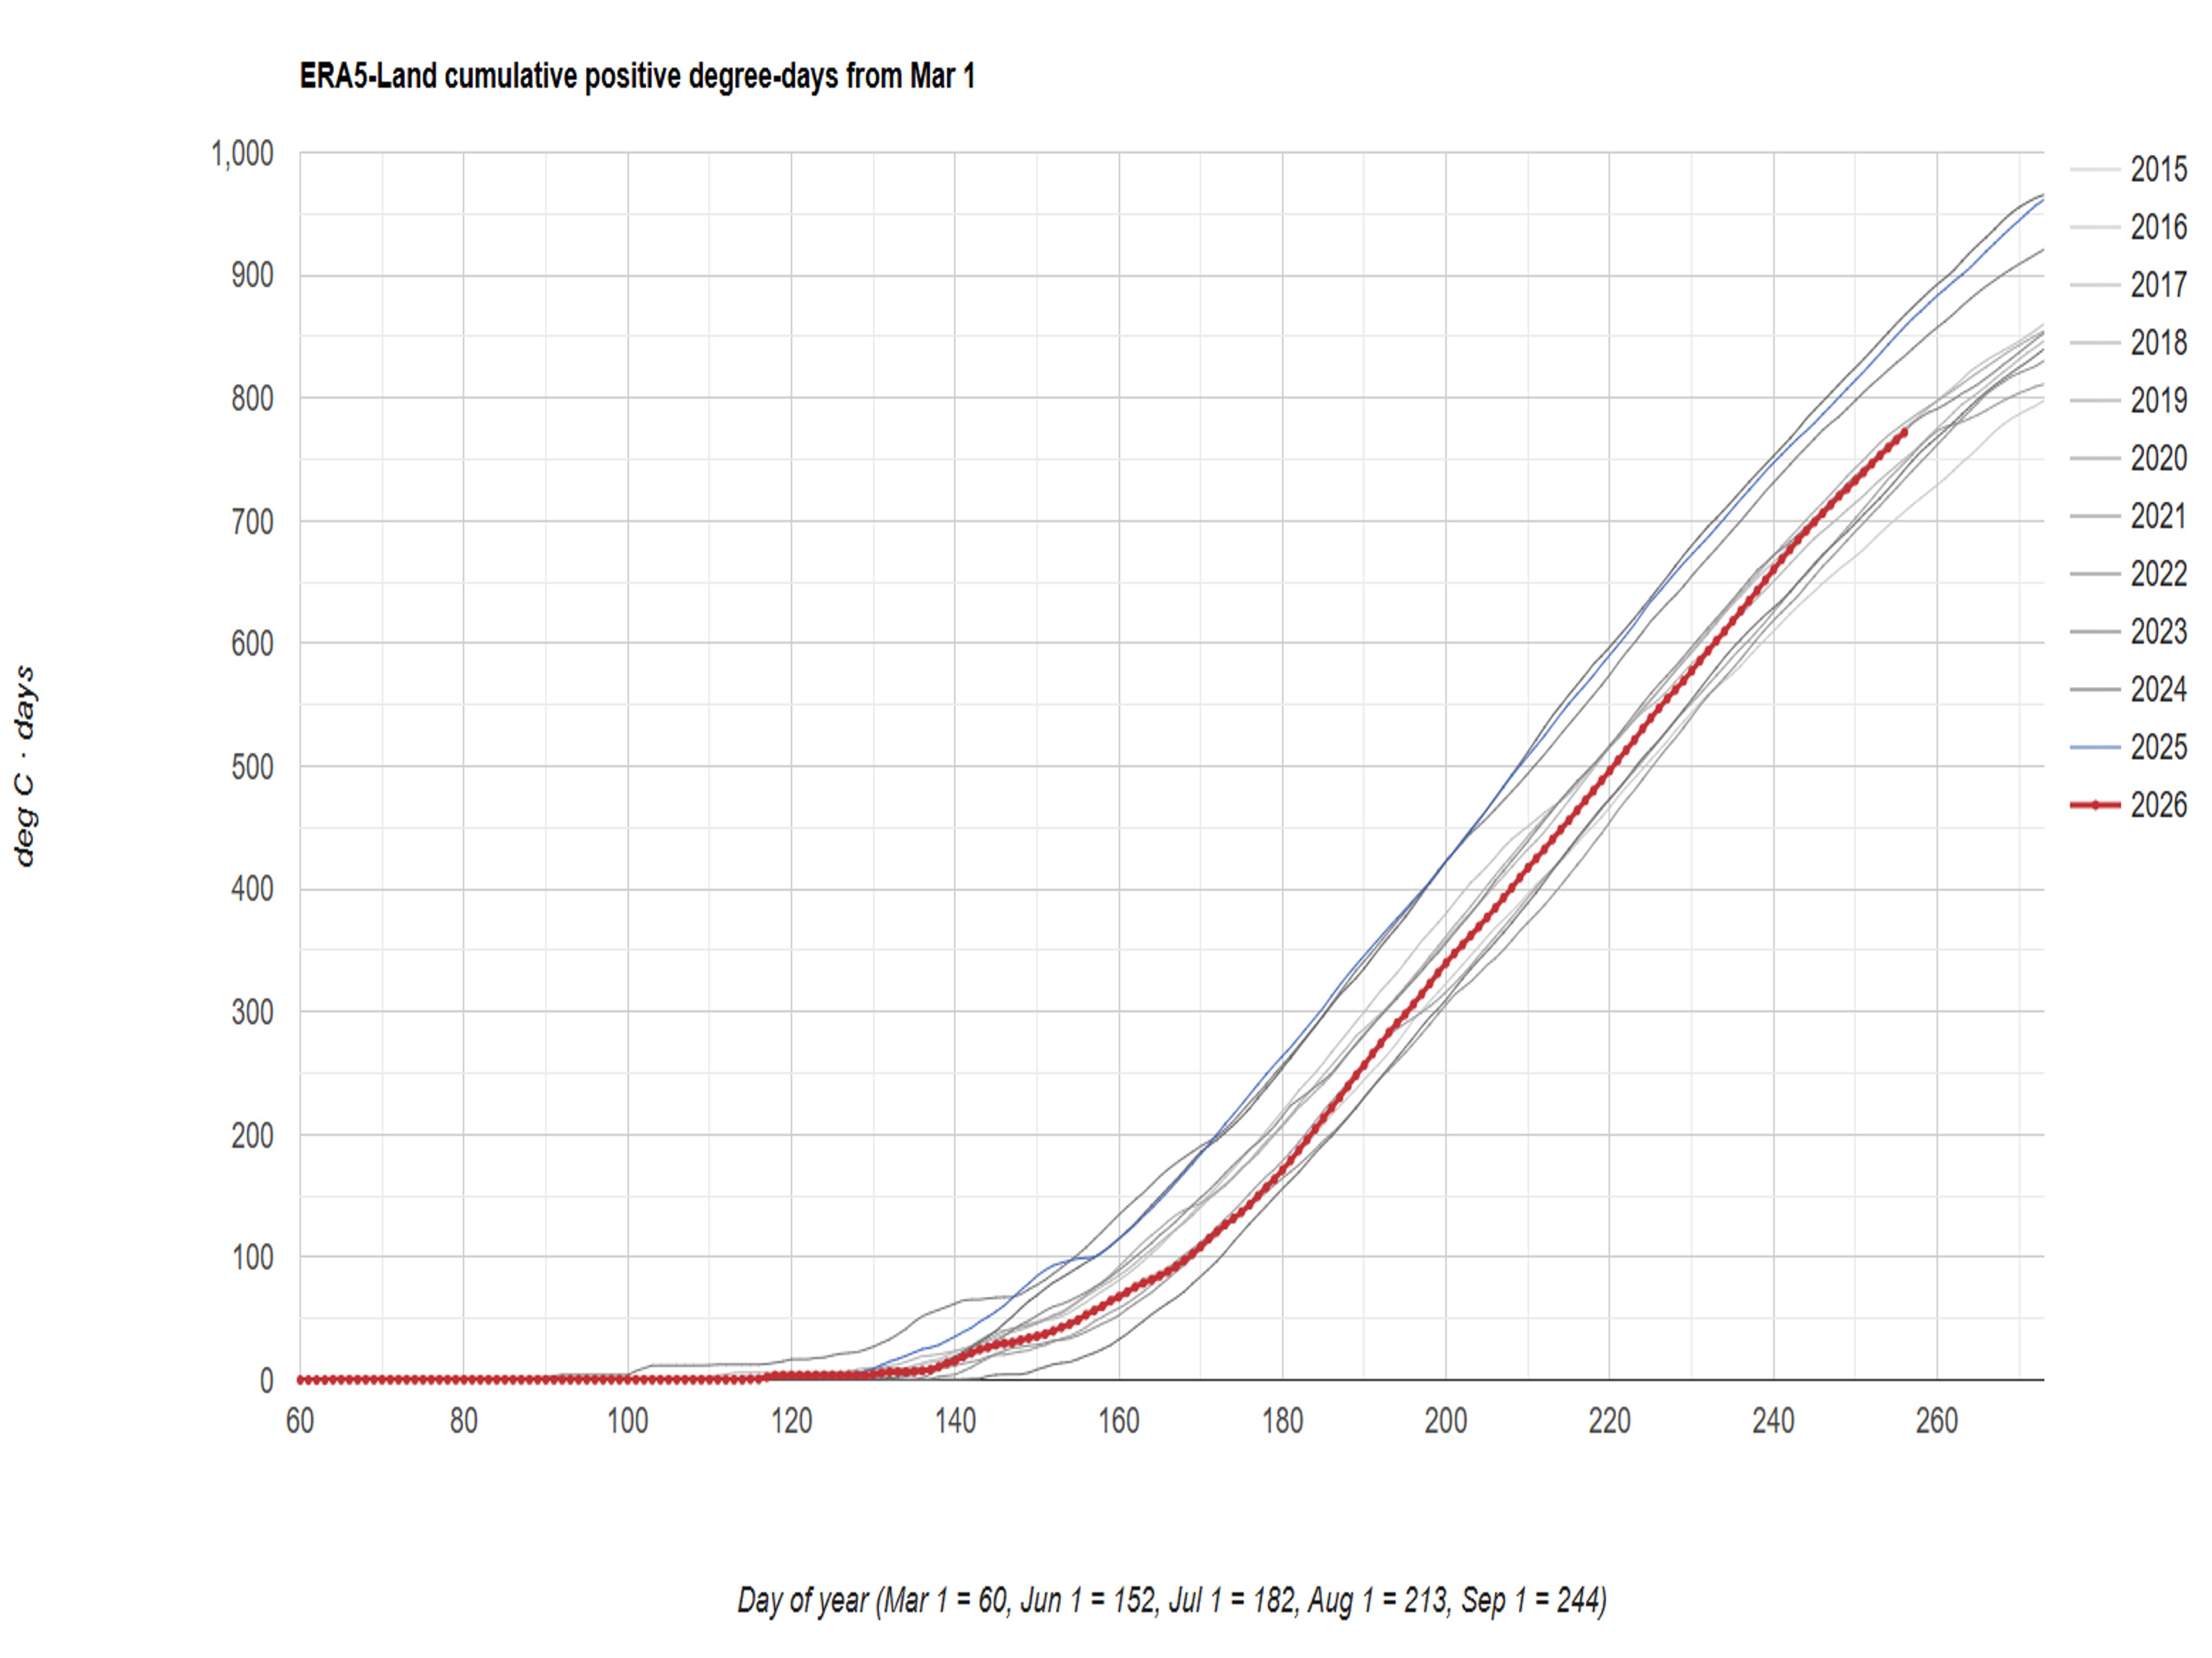
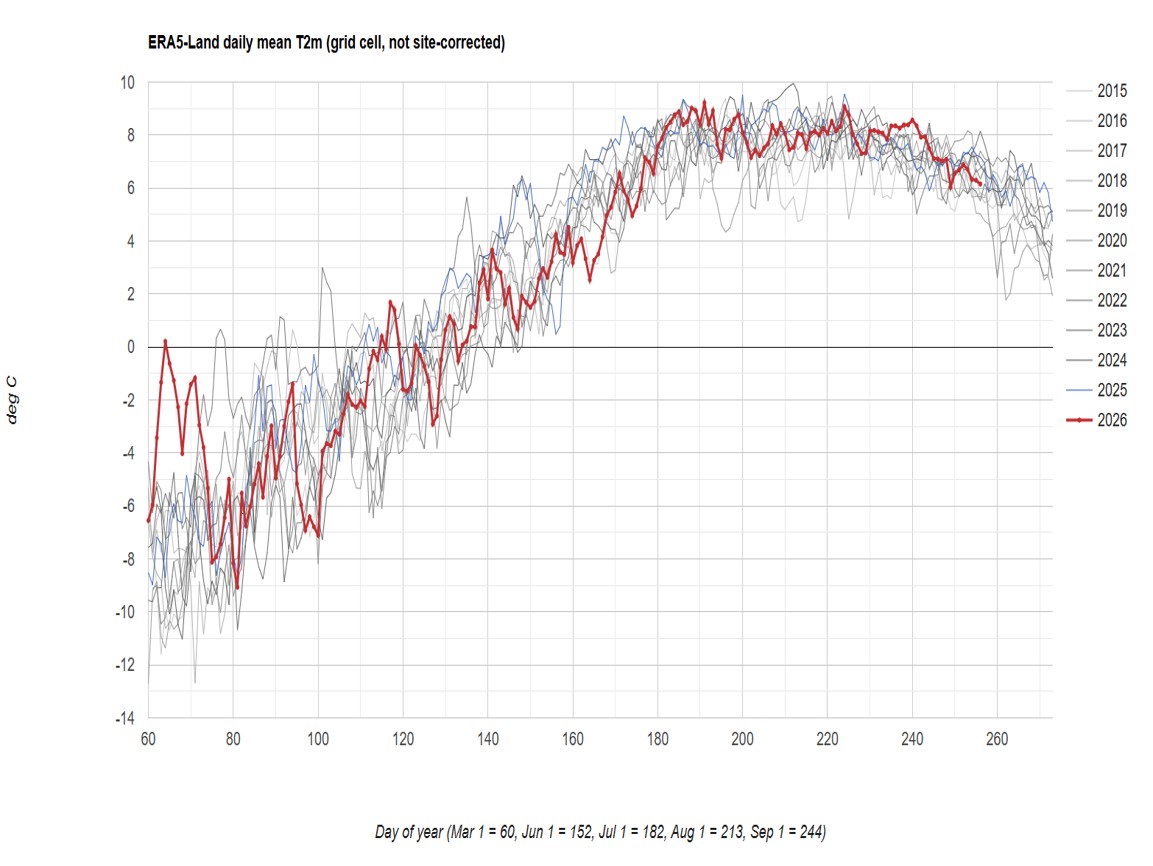
Seasonal temperatures in spring and summer 2026 were higher than usual, although mostly not exceptional compared with the previous ten years. One noticeably unusual warm spell did occur in the first half of March, when temperatures over 1–15 March were 5 °C higher than the 2015–2025 mean. See the two charts below (click to enlarge).